
Pipeline velocity is a key KPI for demand generation in B2B marketing that measures the speed at which opportunities move through the sales pipeline to become closed deals. It combines multiple factors that determine sales growth:
- Number of opportunities
- Average deal size
- Win rate
- Length of sales cycle
Pipeline velocity tells you how quickly qualified opportunities move through the sales pipeline. It measures how quickly leads convert into paying customers and how efficient the sales process is.
By tracking sales pipeline velocity, you as a B2B marketer can evaluate the effectiveness of your programs in generating high-quality, revenue-generating leads.
Formula for Pipeline Velocity
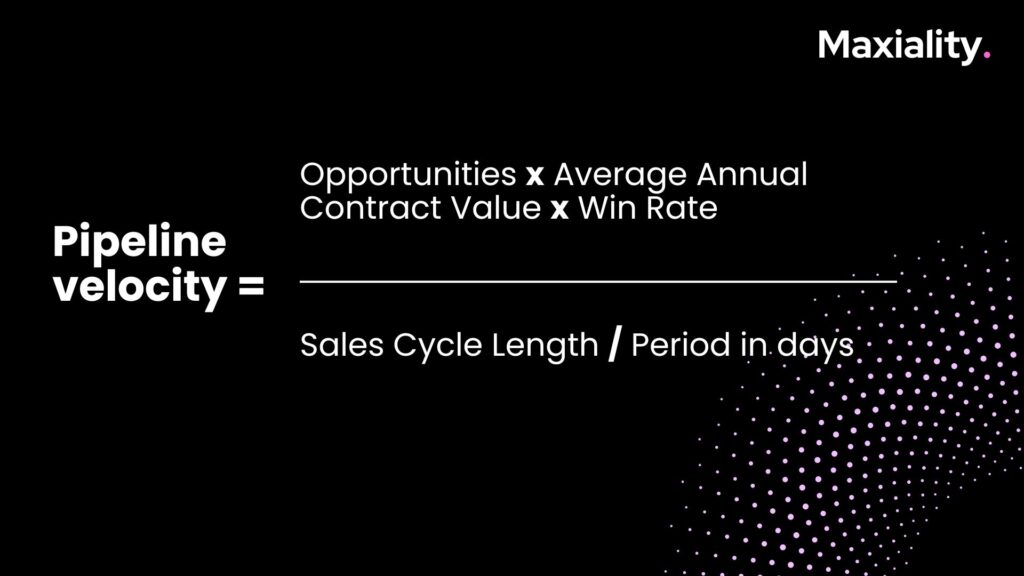
The formula to calculate Pipeline Velocity is:
Pipeline Velocity = (Opportunities x Average Annual Contract Value x Win Rate) / (Sales Cycle Length / Period in days)
Example: if you had 50 qualified opportunities in Q3, with an average ACV of €75k, and an average sales cycle of 90 days, and a win rate of 30 percent.
Number of qualified opportunities in Q3: 50
Average ACV: €75,000
Average length of sales cycle: 90 days
Win rate: 30 percent
We can then calculate pipeline velocity as follows:
Pipeline Velocity = (Opportunities x Average Annual Contract Value x Win Rate) / (Sales Cycle Length / Period in days)
By entering the numbers:
Pipeline velocity = (50 x €75,000 x 30%) / 90 days
= €1,125,000 / 90 days
= €12,500 per day
So the pipeline velocity for this example would then be €12,500 per day or €375,000 per month.
This means that in the third quarter, with 50 qualified opportunities going through the 90-day sales cycle with a 30% profit rate and an ACV of €75,000, the company could generate about €1.125 million in revenue that quarter.
Let’s break down each factor of the formula for pipeline velocity:
Opportunities (Number of Opportunities): These are the total number of potential deals or sales opportunities in your pipeline during a specific time period. It includes both qualified and potential leads.
Example: If you have 50 opportunities in your pipeline, this means there are 50 potential deals being considered or worked on by your sales team.
ACV – Average Annual Contract Value: This is the average value of a closed deal. It helps in understanding the revenue generated from each successful sale.
Example: If the average deal size is $75,000, it means that each closed deal contributes an average of $75,000 in revenue per year.
Win percentage: The win percentage represents the percentage of opportunities that result in successful closed deals. It reflects the effectiveness of your sales team in converting opportunities into actual revenue.
Example: A win rate of 30% means that, on average, 30 out of 100 opportunities in the pipeline result in closed deals.
Sales cycle length: This is the average time it takes an opportunity to go through the entire sales process, from initial contact to closing the deal.
Example: If the length of the sales cycle is 90 days, this means it takes an opportunity an average of 90 days to go from the initial stage to a closed deal.
How to improve pipeline velocity
Some ways B2B marketers can use pipeline velocity to improve their opportunity generation efforts:
- Analyze pipeline velocity by lead source and channel to identify the most efficient sources of leads. Break down pipeline velocity by lead source (inbound vs. outbound etc.) and marketing channels (organic via Google, social media, email etc.) to identify the most efficient sources.
- Shorten the sales cycle for leads through better lead nurturing and handoffs to sales. Faster sales cycles directly accelerate pipeline velocity.
- Improve lead quality by identifying prospects’ buying intent signals and using lead qualification. Might be a bit obvivious, of course, but higher quality leads convert faster, increasing pipeline velocity.
- Set goals for pipeline velocity per lead source and continually optimize programs. If a channel is not meeting velocity benchmarks, refine targeting and messaging.
- Use self-attribution to analyze the impact of marketing on pipeline velocity. See which programs are impacting the fastest achievement of pipeline milestones.
In my experience, it’s best to analyze the pipeline velocity on a quarterly basis and check the difference between the quarters. If the trend is going up, your B2B marketing efforts are working! 🙂
In short, pipeline velocity provides data-based insights for B2B marketers to continually refine their lead generation process – from attraction to sales – to accelerate revenue growth.
Also read: what is a buyer persona and what is a demand generation agency?